The latest tracker reveals that US operators benefited from a boost in cocktail sales over the past quarter, up by +7%. This continuing popularity for the category shows promising opportunities into the rest of 2023.
Across the week, Saturdays remain the most popular day, with a +19% increase in velocity vs Q3 – seeing it pull clear of Friday. Weekdays have also had a strong quarter, with each day from Monday to Thursday seeing growth from compared to 2021. This has come at the expense of Sundays, which continue to struggle as velocity is now -11% below Q4 last year, highlighting how purchasing preferences have shifted from Sundays to Saturdays.
Unsurprisingly the breakfast/brunch daypart has been struggling for cocktail performance, with velocity down -21% vs Q3, but also -12% vs Q4 2021. The biggest winner vs the previous 12-week period was mid-afternoon, with consumers choosing to head out when the day is at its warmest and lightest rather than earlier in the morning.
The growth in cocktails’ velocity vs Q3 has been driven by performance within eating-led outlets (up +8%), while drink-led outlets are performing similarly to Q3 but -6% down vs Q4 2021. Polished Casual outlets continue to benefit from higher sales; however Fine Dining has seen the most growth vs Q3 (+23%), with velocity also up +10% vs last year.
Within drink-led outlets, the strong performance of Sports Bars up to Q3 2022 has been maintained, with continued growth in the latest quarter resulting in an uplift of +54% compared to Q4 2021.
When looking at total cocktails by state Nevada and California remain on top, with both experiencing growth in velocity vs Q3 and last year. Illinois stands out with a strong Q4 performance – driven by an increase in both traffic and check value. Velocity from cocktails here being +20% up compared to last year. The state bucks the trend seen in dayparts, with growth vs Q3 and vs last year at breakfast/brunch, as well as a velocity increases over each other daypart.
Andrew Hummel, Client Solutions Director – Americas, said: “The latest cocktail tracker shows multiple shifting dynamics at play impacting the performance of the category. Our dataset allows us to pinpoint and understand these shifts over the quarter and year-on-year to give brands a view of the evolving nature of the category. This helps suppliers identify growth opportunities across channels, dayparts and at state-level view to build successful strategies in the market.”
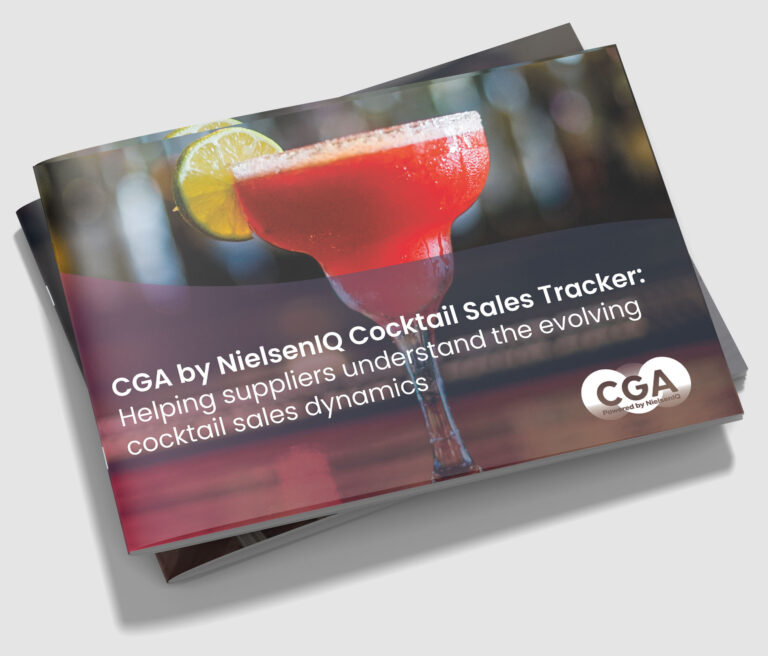
CGA’s Quarterly Cocktail Sales Tracker is available to purchase now. Delivered as a quarterly report, the tracker is powered by CGA’s BeverageTrak, and ensures suppliers can understand the evolving cocktail sales dynamics over time to maintain a winning cocktail strategy in the On Premise.
For more information on the Cocktail Sales Tracker, click here, or contact Andrew Hummel at Andrew.Hummel@cgastrategy.com
*Latest 12 weeks to December 31, 2022
Source: CGA BeverageTrak Cocktail Tracker Q4 2022 report


 Andrew Hummel, Client Solutions Director – Americas, said: “The latest cocktail tracker shows multiple shifting dynamics at play impacting the performance of the category. Our dataset allows us to pinpoint and understand these shifts over the quarter and year-on-year to give brands a view of the evolving nature of the category. This helps suppliers identify growth opportunities across channels, dayparts and at state-level view to build successful strategies in the market.”